Earthquakes and Solar Winds
- April 06, 2017 08:08 AM
- Contributed by: Farley
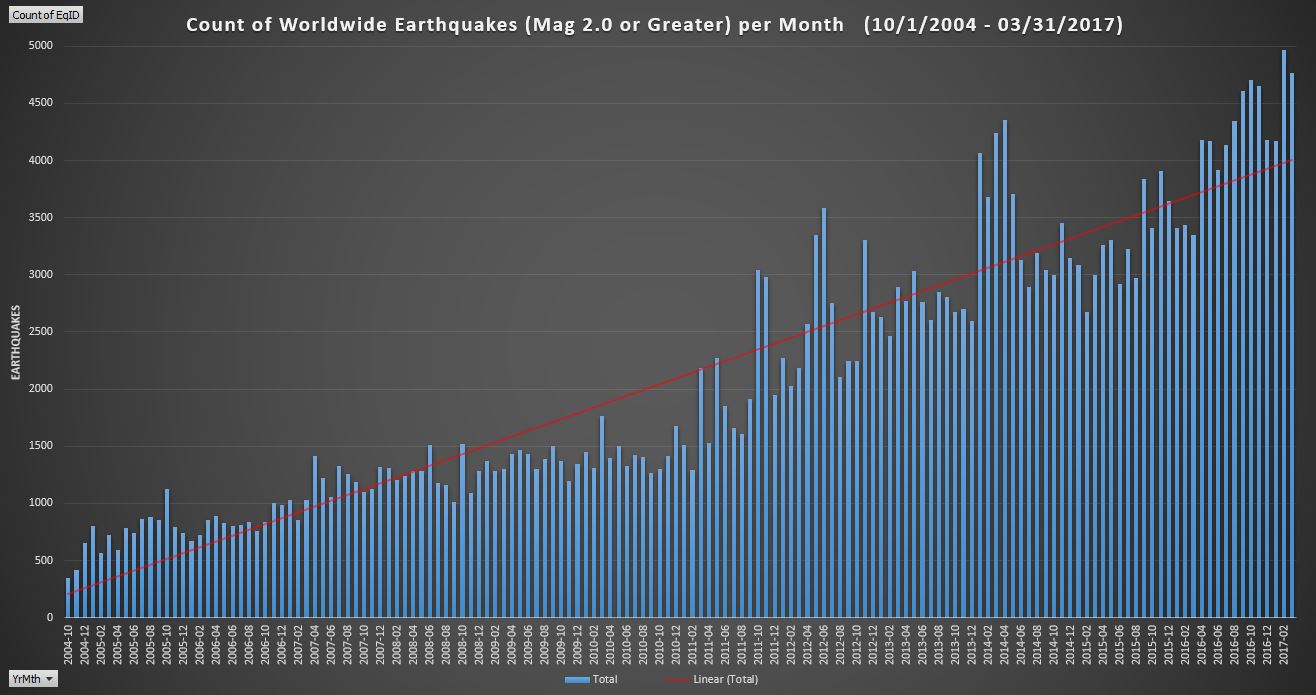
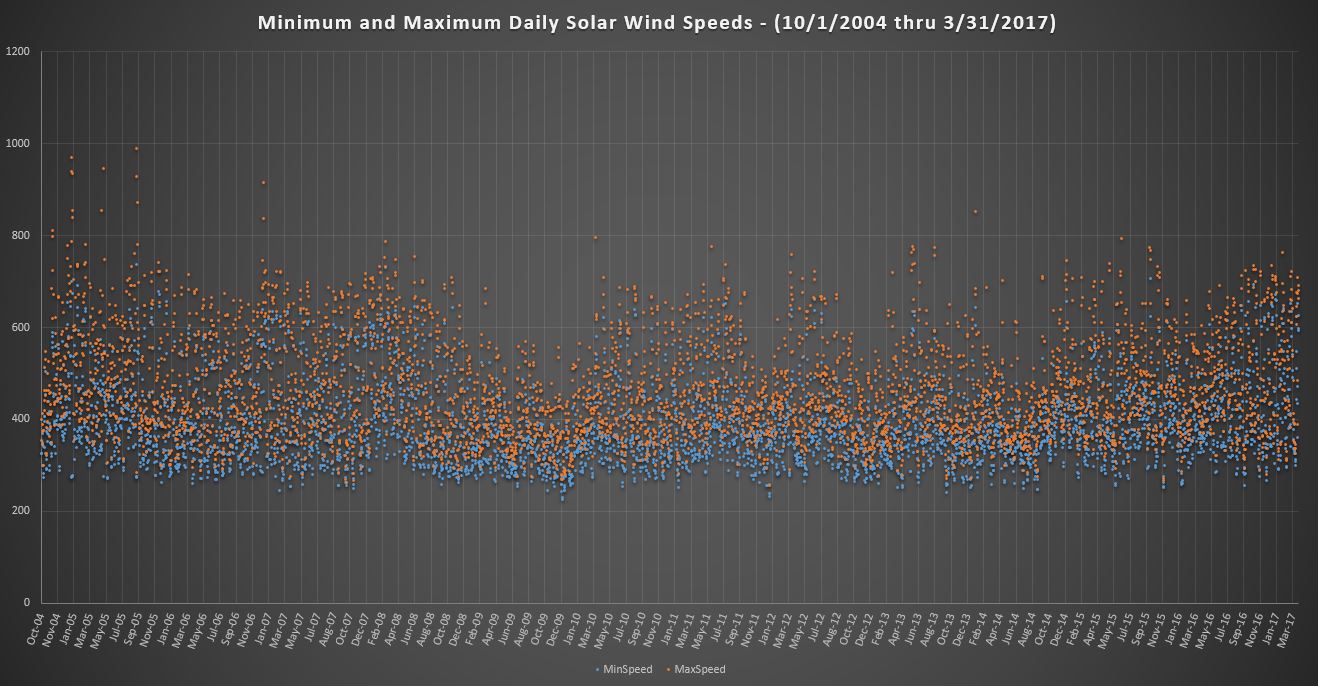
I have read and heard YouTube videos where changes in the Solar Wind Speeds can lead to Earthquakes. If this is true, it doesn't explain the significant increases in the number of earthquakes worldwide since 2004 when comparing the following two charts.
 |
 |
|
Current Earthquakes I'm Sensing ...( last 24 hours )  |
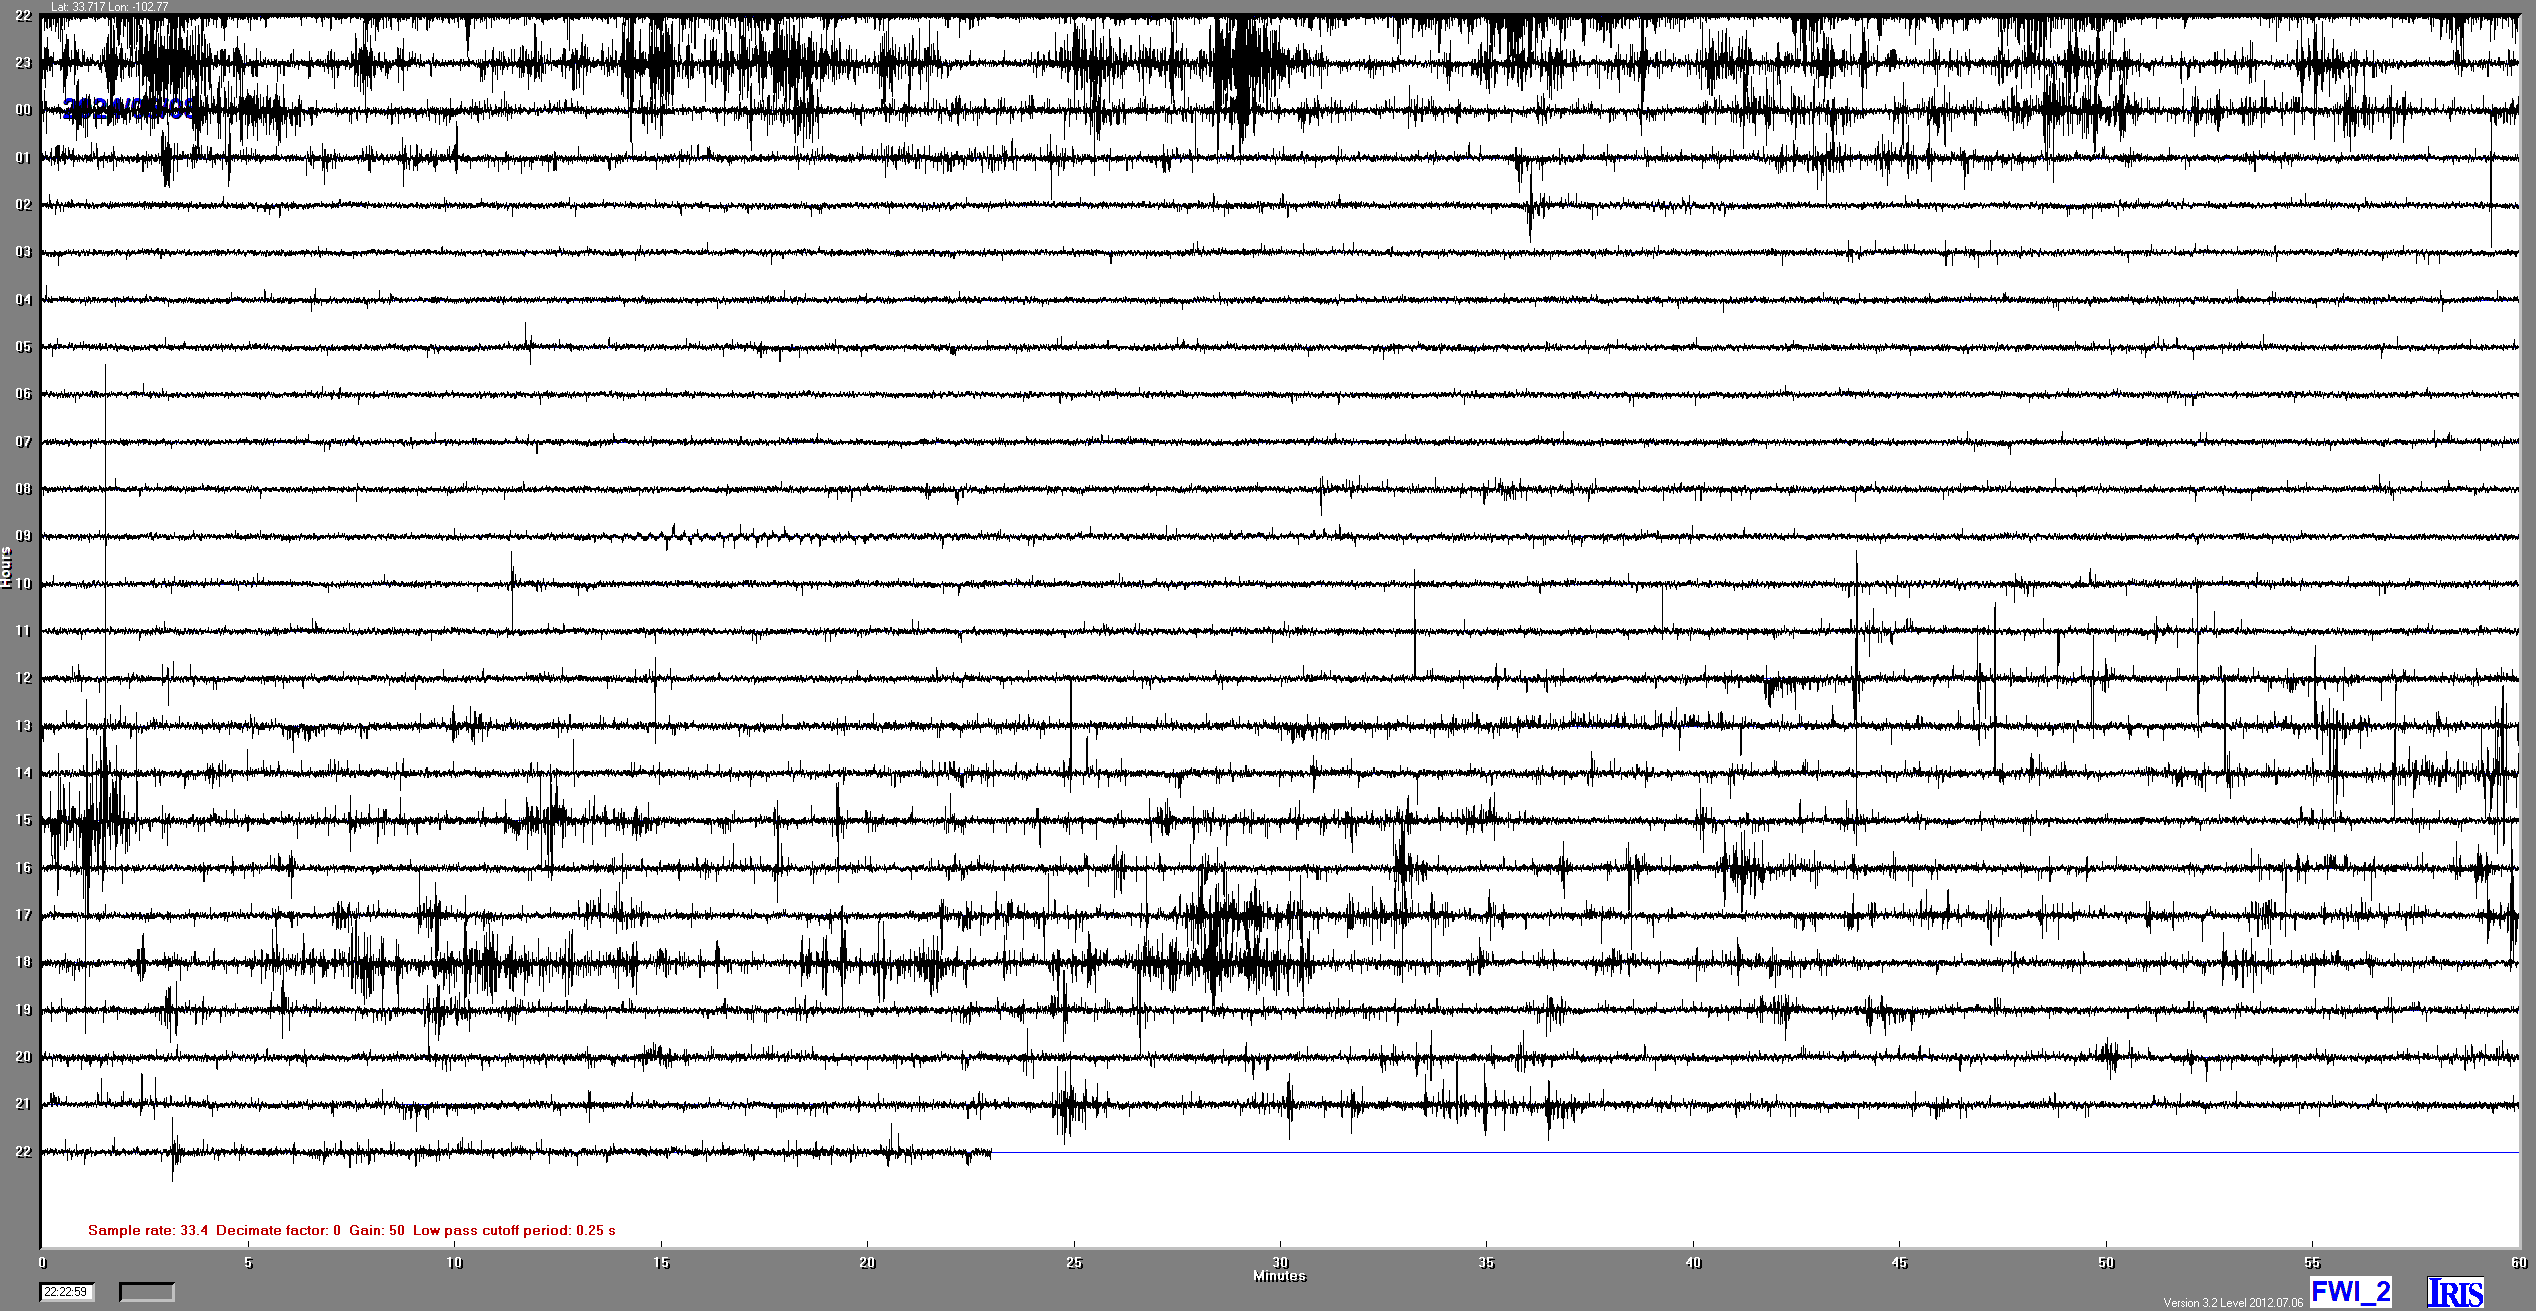 |
So what is really causing the significant increases in the number of earthquakes worldwide since 2004?
The answer may be something else having a mass large enough to perturb or create unusual stresses upon the earth. The closest recent article that I have located is Planet X: Four Candidates For Planet X Located And Examined dated April 1, 2017. No, I don't believe the article to be an 'April Fools' joke.
One answer just might include multiple dark dwarf star objects of significant mass passing near enough to earth to cause unusual stresses with increasing frequency ... which would correlate to the spikes seen in the above Earthquake Chart.
The Charting Data Sources:
Earthquake Data ... For validation for any particular month: Define Your Criteria. Be sure to enter a Minimum Magnitude of 2.0.
Solar Wind Data ... The files used were from "200410_ace_swepam_1h.txt" thru "201703_ace_swepam_1h.txt"
The following are the Regions where 1,000 or more earthquakes occurred having a minumum magnitude of 2.0 and between the UTC Dates of 2004-10-01 and 2017-03-31.
NOTE: California shows up more than halfway down this list, however the whole of California has a sum total of 5,465 earthquakes.
| Region | Min Mag | Max Mag | First | Last | Count |
|---|---|---|---|---|---|
| WESTERN TURKEY | 2.00 | 5.80 | 2004-10-04 | 2017-03-31 | 28096 |
| GREECE | 2.00 | 6.50 | 2004-10-08 | 2017-03-31 | 18287 |
| EASTERN TURKEY | 2.00 | 7.20 | 2004-10-01 | 2017-03-31 | 17806 |
| CENTRAL TURKEY | 2.00 | 5.50 | 2004-10-03 | 2017-03-31 | 10541 |
| CRETE, GREECE | 2.00 | 6.40 | 2004-10-01 | 2017-03-30 | 8008 |
| DODECANESE ISLANDS, GREECE | 2.00 | 6.40 | 2004-10-03 | 2017-03-29 | 6751 |
| CENTRAL ITALY | 2.00 | 6.50 | 2004-10-08 | 2017-03-31 | 6747 |
| SOUTHERN GREECE | 2.00 | 6.90 | 2004-10-07 | 2017-03-31 | 6712 |
| NEAR THE COAST OF WESTERN TURKEY | 2.00 | 5.90 | 2004-10-06 | 2017-03-31 | 6711 |
| AEGEAN SEA | 2.00 | 6.90 | 2004-10-10 | 2017-03-29 | 5783 |
| ANTOFAGASTA, CHILE | 2.00 | 7.70 | 2004-10-03 | 2017-03-31 | 4867 |
| OKLAHOMA | 2.00 | 5.60 | 2009-02-22 | 2017-03-30 | 4685 |
| NORTHERN ITALY | 2.00 | 6.10 | 2004-10-07 | 2017-03-31 | 4323 |
| PUERTO RICO REGION | 2.00 | 6.40 | 2007-01-07 | 2017-03-31 | 4004 |
| TARAPACA, CHILE | 2.00 | 7.80 | 2004-11-02 | 2017-03-30 | 3564 |
| SICILY, ITALY | 2.00 | 5.80 | 2004-10-03 | 2017-03-31 | 3351 |
| ALBANIA | 2.00 | 5.60 | 2004-10-18 | 2017-03-28 | 3126 |
| VIRGIN ISLANDS REGION | 2.00 | 6.00 | 2004-12-11 | 2017-03-31 | 2913 |
| SOUTHERN ITALY | 2.00 | 5.30 | 2004-10-01 | 2017-03-30 | 2771 |
| DODECANESE IS.-TURKEY BORDER REG | 2.00 | 5.20 | 2013-01-01 | 2017-03-30 | 2681 |
| KURIL ISLANDS | 3.00 | 8.30 | 2004-10-01 | 2017-03-31 | 2675 |
| FRANCE | 2.00 | 4.90 | 2004-10-01 | 2017-03-31 | 2455 |
| CYPRUS REGION | 2.00 | 5.90 | 2004-10-13 | 2017-03-26 | 2281 |
| ROMANIA | 2.00 | 6.00 | 2004-10-05 | 2017-03-31 | 2262 |
| OFFSHORE TARAPACA, CHILE | 2.00 | 8.10 | 2005-09-19 | 2017-03-23 | 2221 |
| OFFSHORE COQUIMBO, CHILE | 2.10 | 8.30 | 2005-12-31 | 2017-03-30 | 2141 |
| SOUTHERN IRAN | 2.50 | 6.30 | 2004-10-06 | 2017-03-25 | 2097 |
| POLAND | 2.00 | 4.90 | 2004-10-06 | 2017-03-30 | 2093 |
| NEAR EAST COAST OF HONSHU, JAPAN | 3.80 | 9.00 | 2004-10-16 | 2017-03-22 | 2082 |
| NEVADA | 2.00 | 6.00 | 2008-02-21 | 2017-03-31 | 2045 |
| CANARY ISLANDS, SPAIN REGION | 2.00 | 5.10 | 2005-02-02 | 2017-03-26 | 2040 |
| CENTRAL CALIFORNIA | 2.00 | 5.20 | 2005-04-16 | 2017-03-31 | 2026 |
| ISLAND OF HAWAII, HAWAII | 2.00 | 5.60 | 2005-11-30 | 2017-03-31 | 1991 |
| IONIAN SEA | 2.00 | 5.70 | 2004-10-05 | 2017-03-31 | 1961 |
| NORTHERN CALIFORNIA | 2.00 | 5.70 | 2005-06-26 | 2017-03-31 | 1934 |
| ANDREANOF ISLANDS, ALEUTIAN IS. | 2.00 | 7.20 | 2004-12-02 | 2017-03-29 | 1855 |
| SOUTHERN ALASKA | 2.00 | 7.10 | 2004-10-17 | 2017-03-31 | 1819 |
| FIJI REGION | 4.00 | 7.30 | 2004-10-03 | 2017-03-24 | 1810 |
| COQUIMBO, CHILE | 2.10 | 7.00 | 2004-12-08 | 2017-03-31 | 1736 |
| OFF EAST COAST OF HONSHU, JAPAN | 3.90 | 7.60 | 2004-12-23 | 2017-03-24 | 1572 |
| STRAIT OF GIBRALTAR | 2.00 | 6.30 | 2004-10-10 | 2017-03-28 | 1524 |
| CZECH REPUBLIC | 2.00 | 4.40 | 2004-10-06 | 2017-01-15 | 1521 |
| SOUTHERN CALIFORNIA | 2.00 | 5.60 | 2005-06-12 | 2017-03-31 | 1505 |
| NORTHERN COLOMBIA | 2.00 | 6.20 | 2004-10-03 | 2017-03-31 | 1474 |
| EASTERN MEDITERRANEAN SEA | 2.00 | 5.90 | 2004-10-23 | 2017-03-26 | 1316 |
| FOX ISLANDS, ALEUTIAN ISLANDS | 2.00 | 7.30 | 2004-10-21 | 2017-03-28 | 1284 |
| VANUATU | 4.00 | 7.40 | 2004-10-11 | 2017-03-29 | 1264 |
| TAJIKISTAN | 3.00 | 7.20 | 2004-10-05 | 2017-03-28 | 1233 |
| TONGA | 4.00 | 7.80 | 2004-10-04 | 2017-03-31 | 1228 |
| ALASKA PENINSULA | 2.00 | 6.80 | 2004-12-19 | 2017-03-30 | 1217 |
| OFFSHORE VALPARAISO, CHILE | 2.10 | 6.70 | 2005-03-13 | 2017-03-31 | 1186 |
| HINDU KUSH REGION, AFGHANISTAN | 3.00 | 7.50 | 2004-10-06 | 2017-03-31 | 1185 |
| CENTRAL MEDITERRANEAN SEA | 2.00 | 5.50 | 2004-10-01 | 2017-03-29 | 1176 |
| GERMANY | 2.00 | 5.10 | 2004-10-08 | 2017-03-30 | 1088 |
| SPAIN | 2.00 | 6.30 | 2004-11-10 | 2017-03-29 | 1033 |
| BANDA SEA | 3.80 | 7.60 | 2004-10-10 | 2017-03-31 | 1012 |
| SOUTH OF FIJI ISLANDS | 4.00 | 7.80 | 2004-10-21 | 2017-03-30 | 1012 |
| SOUTHERN XINJIANG, CHINA | 3.00 | 6.90 | 2004-10-05 | 2017-03-27 | 1000 |
NOTE: This article is a work in progress.